Software development often consists of a brief period of pure excitement while writing the bulk of the source code, followed by a long and dreaded period of finding bugs and fixing them. This scheme is no different when writing plugins for QGIS.
Because we also write QGIS plugins ourselves, we were thinking of how to ease the pain of getting rid of bugs – and so we ended up creating the First Aid plugin, now available in the official QGIS plugin repository.
It is meant to be a Swiss army knife for QGIS plugin developers, a tool that allows easy inspection of any Python code running within QGIS. This is important because it can potentially save developers a lot of their valuable time.
How many times did you end up adding “print” statements into the code to find out what was going wrong in your code? With First Aid plugin this should be no longer necessary.
Error Handler
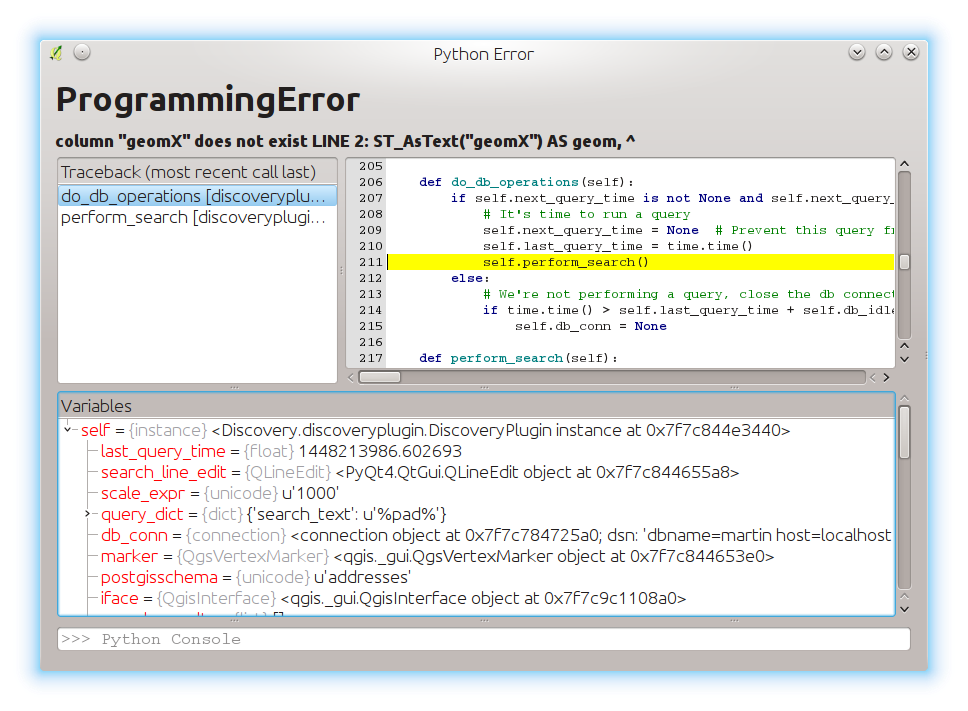
So let me explain what does it do. First of all, it comes with an improved Python error handler. What this means is that whenever an error occurs in code of a plugin, a window with all the details comes up.
Previously in QGIS you could only find out what was the exception’s type, message and stack trace. First Aid plugin adds source code view, variables view and even an embedded Python console where you can further inspect the state of the plugin at the time of the error. Here is how it looks like in action:

Debugger
Plugins however do not always come up with errors that can be caught and handled by QGIS. More often plugins simply do not behave as one would expect them to. Here is when people usually resort to using debuggers. There are IDEs like PyDev or PyCharm - or even standalone tools like Winpdb - that allow developers to do remote debugging. Basically they can connect to the Python environment within QGIS and debug the code there. Personally, I have never been a big fan of this approach and found remote debugging cumbersome to set up and use. And trying to debug something on a client’s computer is even a greater challenge.
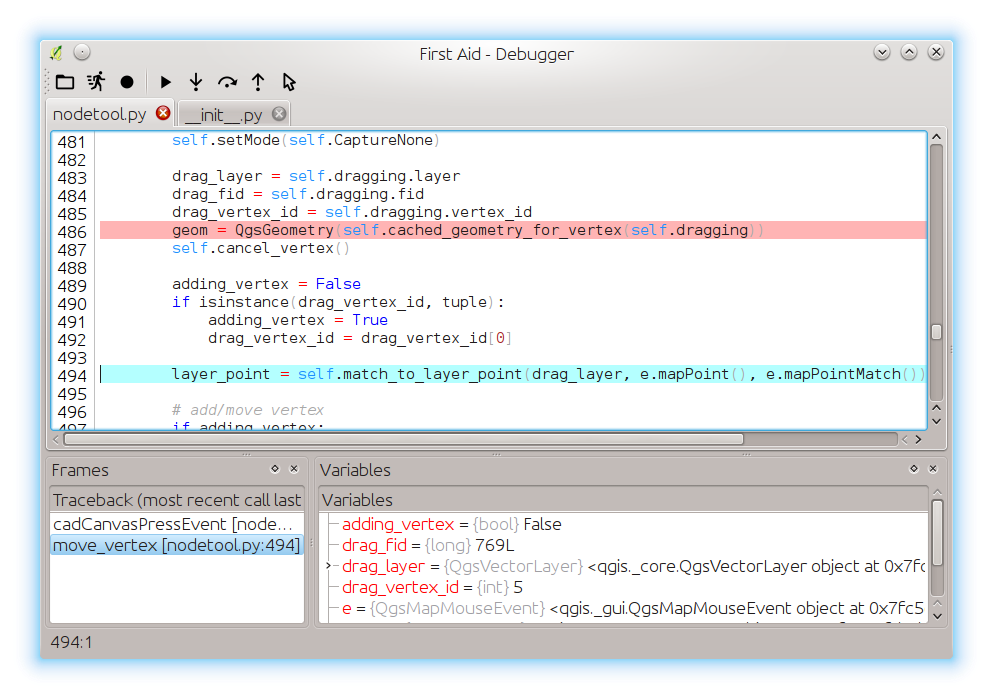
First Aid fortunately integrates a debugger into QGIS environment. This allows developers to simply open the debugger window, load some Python files, set breakpoints and everything is ready. Once QGIS reaches a line with a breakpoint, the debugger window will be activated and it is possible to step through the code and inspect the variables to understand what is going on in the code.

The great thing is that once the execution of Python code is stopped, it is possible to step into code, step over, step out or run to cursor, just like in any other debugger. It is also possible to run custom scripts from within debugger window – they will be also run in debug mode.
Debugging is active only while the debugger window is still open. While debugging, there is some extra overhead when running any Python code (even for code that you do not intend to debug), so it is better to close the debugger when not needed.
The plugin has already helped us various times to quickly identify problems in plugins. Having said that, please note that the plugin is still quite young and may not work perfectly in all cases. We would be happy to hear your feedback. Any issues or pull requests on GitHub would be greatly appreciated!
You may also like...
Mergin Maps, a field data collection app based on QGIS. Mergin Maps makes field work easy with its simple interface and cloud-based sync. Available on Android, iOS and Windows.

