
In QGIS 3, we have introduced support for 3D canvas. Most of the functionalities are intuitive and easy to use. But there are some configuration options which are hidden and require a bit of more in-depth explanation for users and developers.
This blog post and the follow-up ones will discuss a range of topics: data sources, 3D canvas navigation, configuration, working with various types of layers, styling and more!
To work with QGIS 3D, you need data: rasters and vectors. We will use digital terrain model rasters for 3D visualisation purpose. You can download SRTM data from the SRTM Tile Downloader.
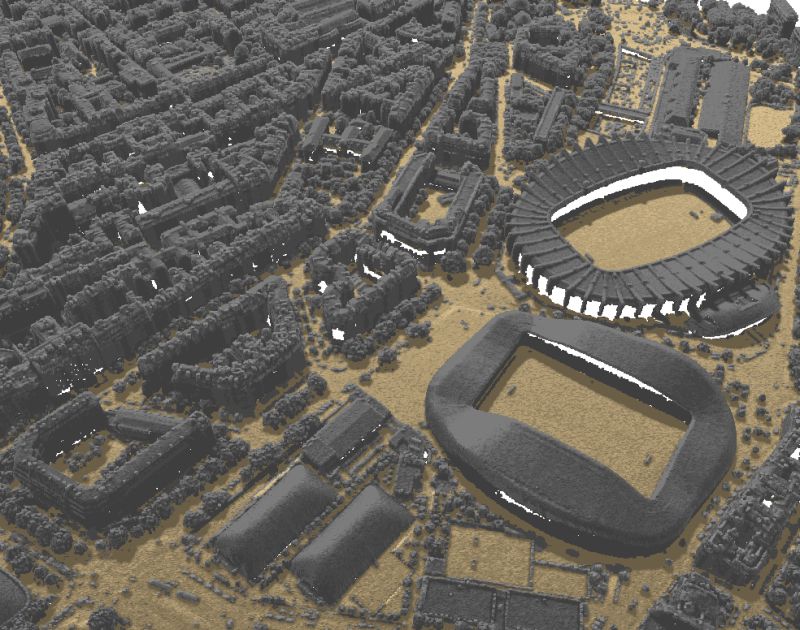
For vectors, you can use any point, line and polygon data. There are different methods of creating 3D objects from each data type in the 3D canvas. If you want true 3D data representing buildings, you can download CityGML data from the list of open CityGML datasets.
For the purpose of these blog posts, we will use SRTM data for Mont Blanc and CityGML data for Berlin.
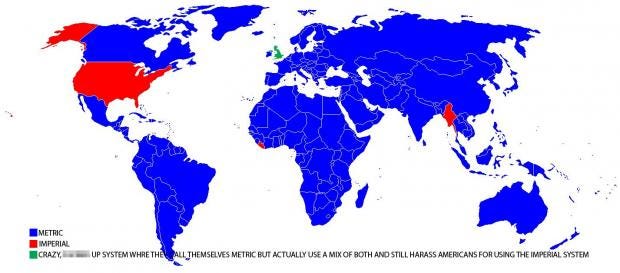
Note: You need to use a projected coordinate reference system in metres (or feet in case you belong to one of these countries) for your data and canvas to be able to use QGIS 3D.
To start with, we are going to add the terrain model for Mont Blanc to the QGIS canvas. Bing Aerial photo (as XYZ tiles layer) was also loaded in QGIS.

Mont Blanc terrain model with Bing aerial in QGIS.
(Click to enlarge)
To view the 3D canvas, in the main menu select View > New 3D Map View
A floating QGIS panel will appear. You can drag the panel to the bottom part of your canvas to dock it.

To start with, the 3D view shows the same extent and view as seen in the 2D canvas. Also note that there is no dedicated toolbar for navigation in the 3D canvas. You can zoom in/out and pan in the 3D canvas in the same way as in the main 2D canvas:
The following additional options allow you to explore the map in 3D:
To reset the camera view, click

button in the 3D canvas panel.
You can use a terrain raster to represent 3D elevation in your canvas. It is expected that such raster layer contains one band where each raster cell represents elevation.To do that, click

button to open a new window with 3D view configuration. After selecting your raster layer for Elevation and clicking OK, you should be able to see Mont Blanc in the 3D view:

In the configuration window there are various other options to fine-tune the 3D scene - let's have a closer look at their meaning.Before diving into the details, it is worth noting that terrain in 3D view is represented by a hierarchy of terrain tiles andas the camera moves closer to the terrain, existing tiles that do not have sufficient detail are replaced by smaller tiles with more details.Each tile has mesh geometry derived from the elevation raster layer and texture created by rendering 2D map for the extent of the tile.

Here is the complete list of the configuration options and their meaning:
Let's make the QGIS work for you
Lutra Consulting is a QGIS-focused expert provider of geospatial software development, consulting, training, and support services.

.png)

