In the world of GIS, vector and raster are the most common data types to represent real world features. But not always, vectors and rasters can describe the complexity and nature of the data.
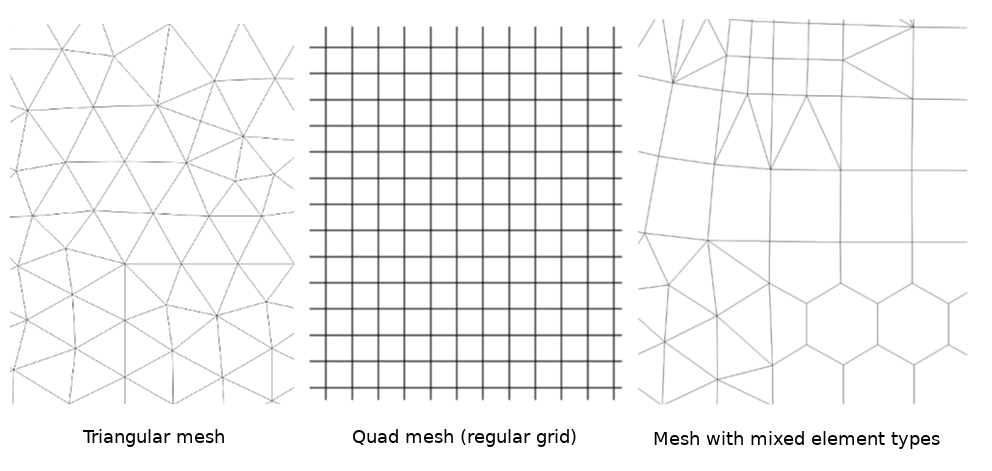
Example of those datasets are:
- Metrological data: e.g. temperature and wind speed
- Hydrological data: flood depth and flow velocity
- Oceanography: salinity and wave flux
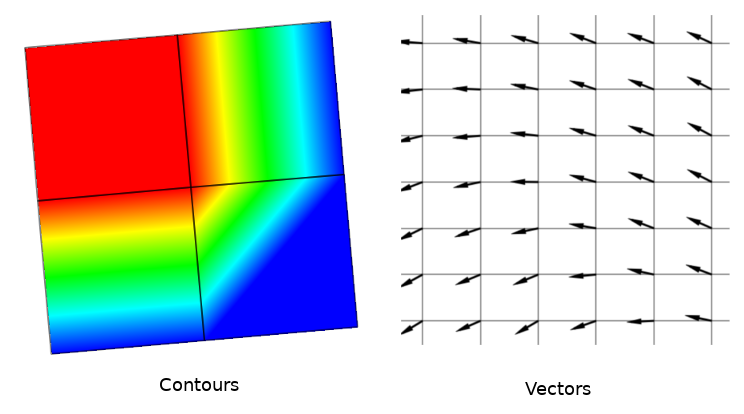
In the past, we introduced Crayfish plugin to handle unstructured grids, usually with temporal and other components. The main issues with Crayfish plugin were:
- Crayfish plugin had its own renderer. Therefore, we had to create binaries and ship them with the plugin. This was not ideal, as not all the platforms (e.g. MacOS) was not supported.
- Crayfish plugin loaded all the data in the memory. For small files, this was not an issue. But there was not a solution for larger files.
Why MDAL?
For more details of the rational behind introducing MDAL, see the QGIS Enhancement Proposal with great suggestions and feedback from the developers.
TL;DR: we needed a new abstraction library to handle the mesh data formats similar to GDAL/OGR dealing with rasters and vectors.
Current state
After the feedback from the QGIS community, we have introduced MDAL library earlier this year. It took us a bit of time to put the infrastructure in place. There are already some formats available from MDAL. The library was integrated to QGIS from 3.2. But extensive improvements and new features were added during 3.4.
There are still more formats to support. In QGIS, we will also need to enhance the spatial indexing and performance of the driver in general. For more information visit MDAL website.
How to work with MDAL layer in QGIS
Here is a mesh layer you can use to load in QGIS. For more data, you can visit the ECMWF(or Copernicus) or NASA websites.
In QGIS, from the main menu > Layer > Data Source Manager. A new window will appear. From the left panel, click on Mesh and point to the downloaded file.
You should be able to see a figure similar to the one below:
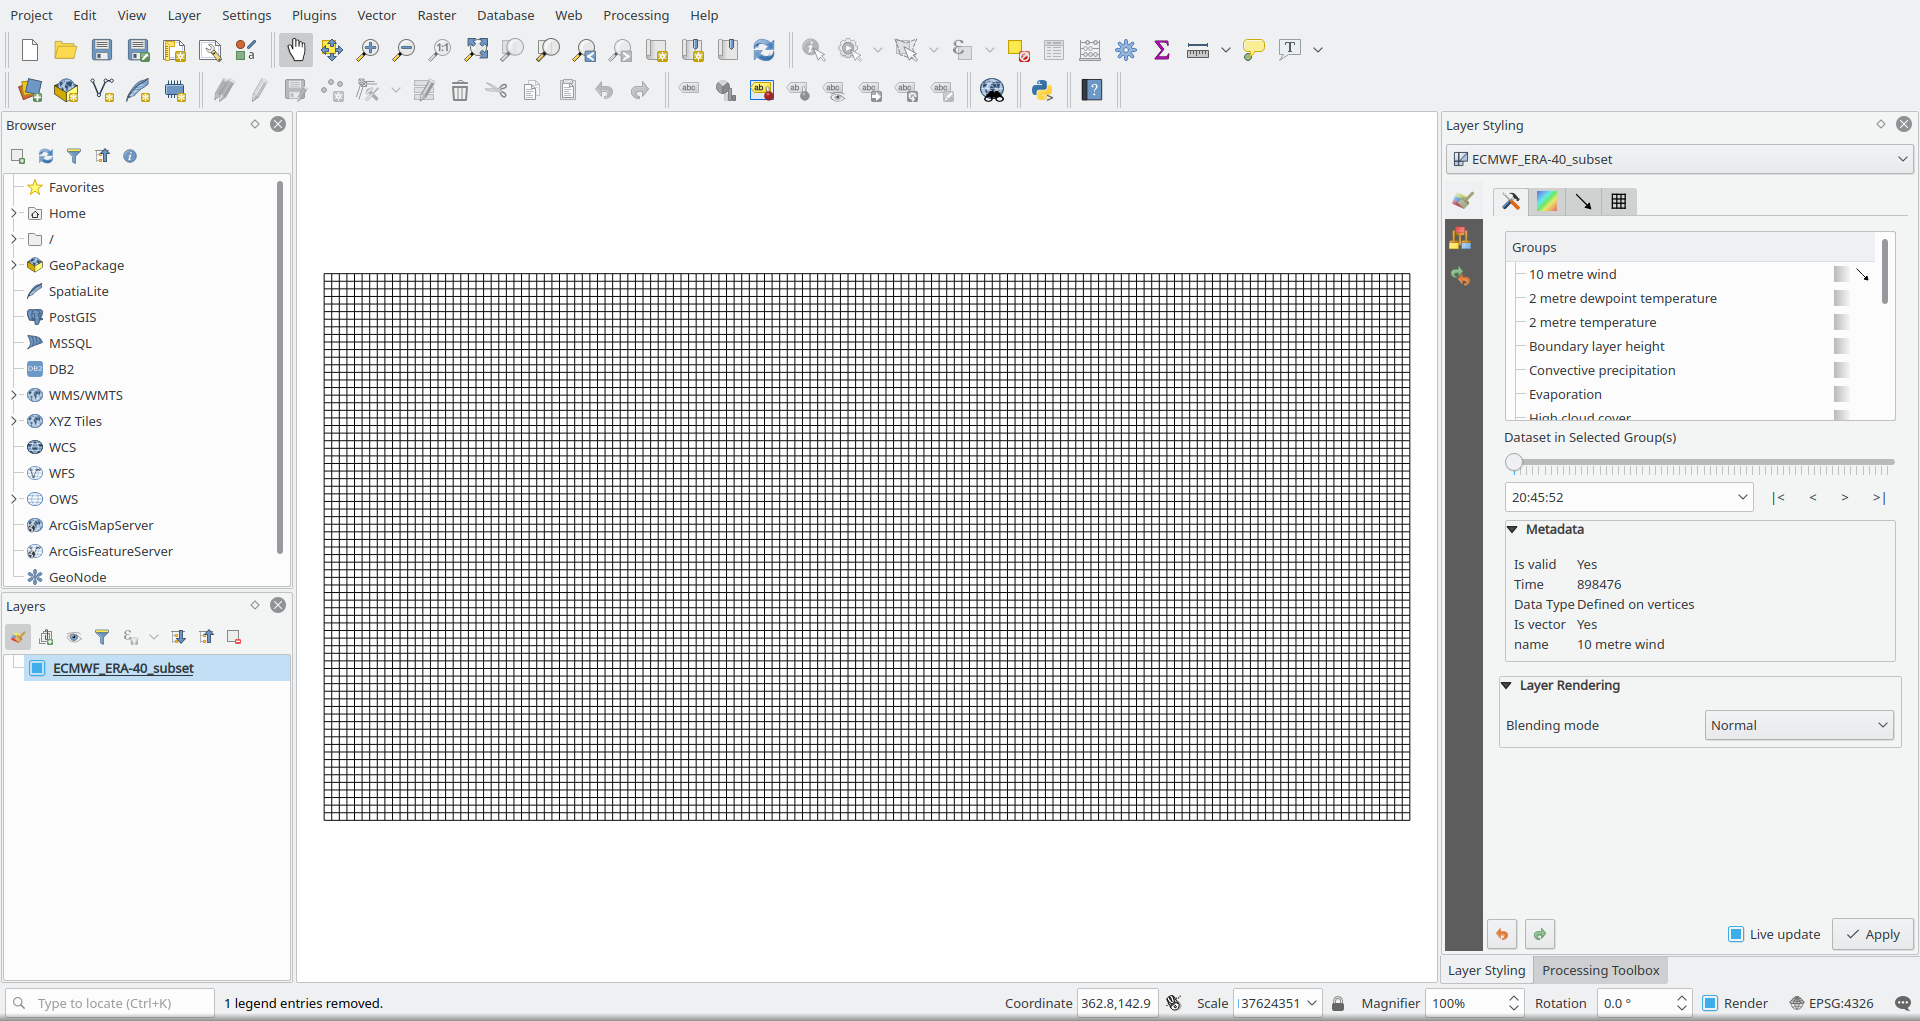
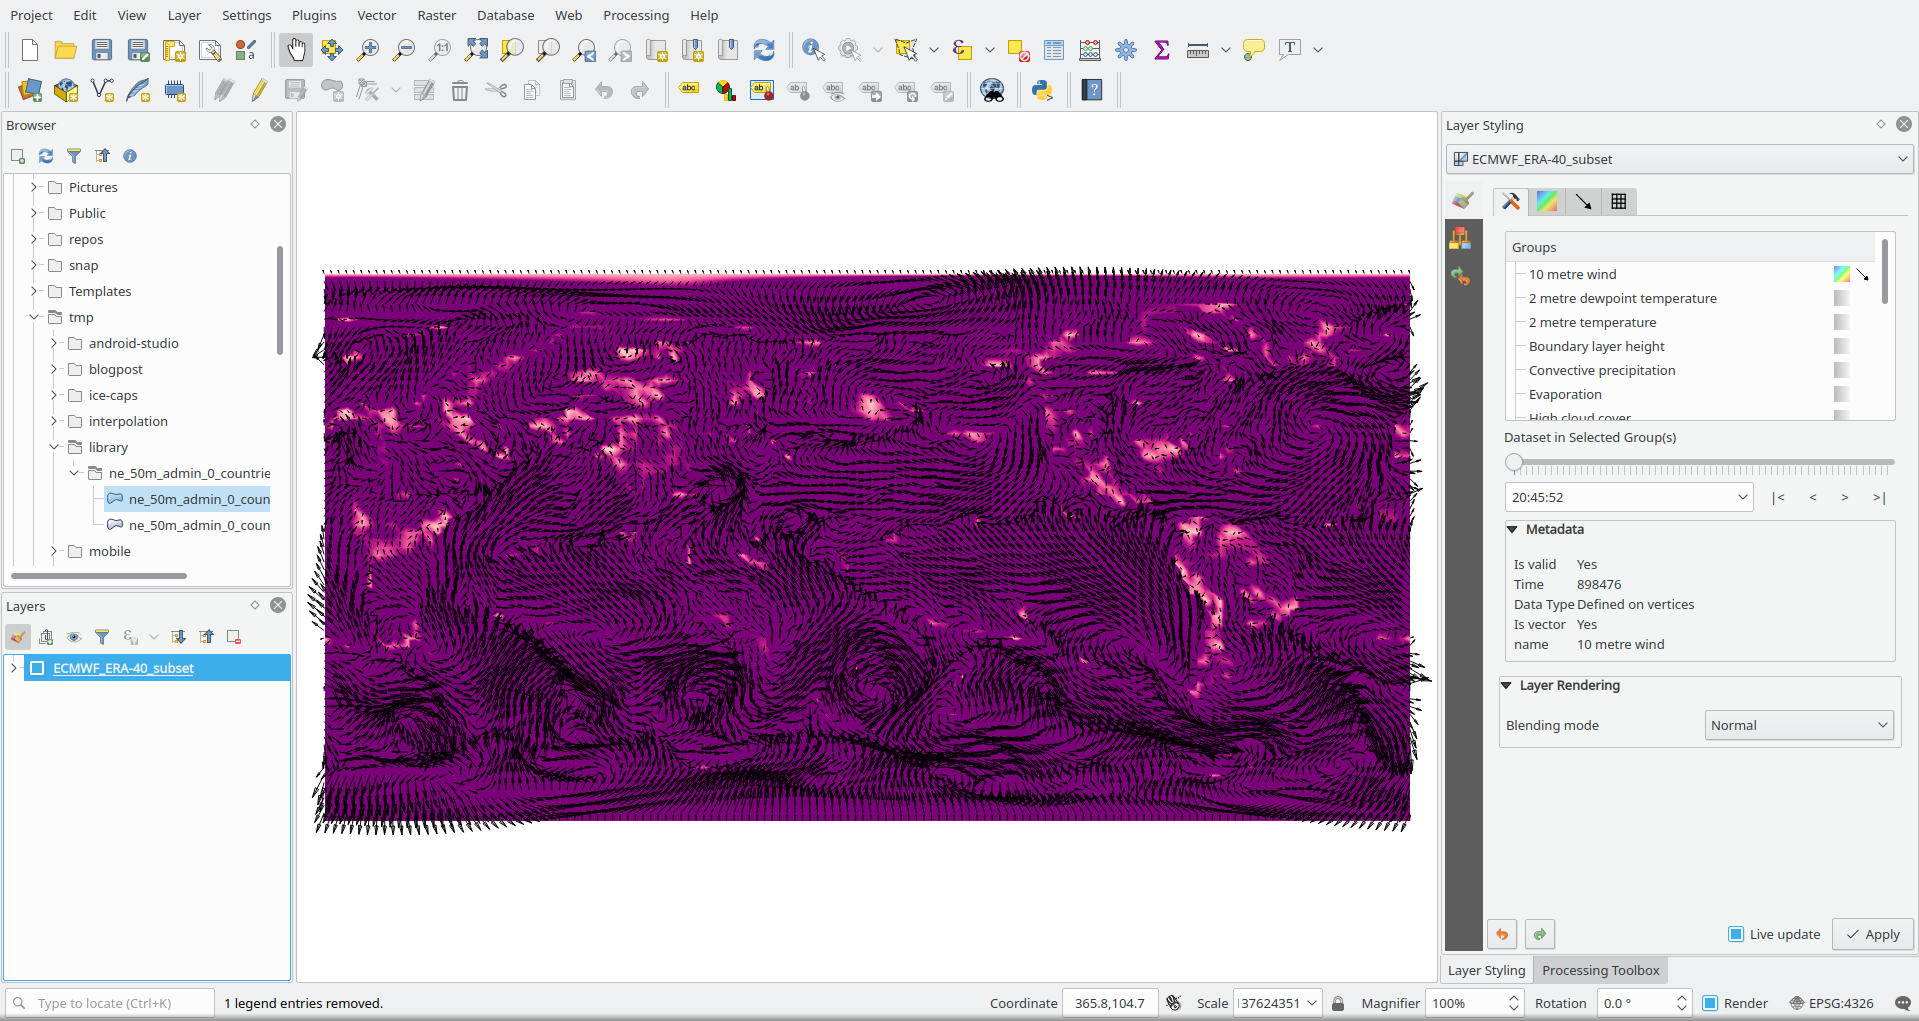
To view quantities within the mesh, you can open the Layer Styling Panel. Click on  Styling tab:
- First select
and deactivate Native Mesh Rendering
- Click on
 and under groups, towards the right of 10 metre wind click on
 and
to view the quantities.
- Below the Groups, you can move the slider to browse through time of the dateset(s).
- To change style of the contours and vectors you can click on
and
tabs and adjust the color ramps and vector sizes accordingly.
What happens to Crayfish plugin?
We have recently released a new version of Crayfish plugin to work directly with mesh layer in QGIS. Crayfish is now based on Python only and can be installed on all main platforms (including MacOS).
Future developments
We are planning to add mesh calculator (either as a core QGIS feature or Crayfish/Processing plugin). There will be more formats in the pipeline to support in MDAL too.
If you’d like to add support for your mesh layer to MDAL, you can follow the examples on the github repository. We are always happy to help.
You may also like...
Mergin Maps, a field data collection app based on QGIS. Mergin Maps makes field work easy with its simple interface and cloud-based sync. Available on Android, iOS and Windows.