In this tutorial, we are going to explore methods of visualising climate data within QGIS using Crayfish plugin. We are going to use September 2017 datasets from NASA which will include Hurricane Irma.
Downloading data
Note: You can download the processed data here. and skip to Viewing data in QGIS.
There are several resources available to obtain climate data. Due to the large volume of data and number of variables, the providers usually offer APIs to interact with dataset repository. But, you can download some datasets directly from their websites.
ECMWF and NASA data portals offering such services.
In this tutorial, we are using NASA portal to download NLDAS Secondary Forcing data for September 2017. Follow the instructions to batch download all the GRIB files using the script provided on their website.
Manipulating data
Each grb file downloaded in the previous step is only for one time step containing multiple variables. You can extract certain variable and also merge the files using Climate Data Operators:
cdo mergetime *.grb september.grb
cdo select,name=var61,var33,var34,var11 september.grb september_prec_wind_temp.grb
The first command will merge all the times and generates a single GRIB file containing all the time step. The second command, extracts temperature, precipitation and wind data.
Viewing data in QGIS
To view the data, you will need Crayfish plugin. Download and install the plugin from the QGIS plugin repository.
Add the GRIB file as a Crayfish layer (under Plugins > Crayfish > Add Crayfish Layer). You should be able to see precipitation, temperature and wind data from the Crayfish panel. Note that the wind data contains vector in addition to grid.
You can use the slider to move the time. Read more on how to use Crayfish plugin.
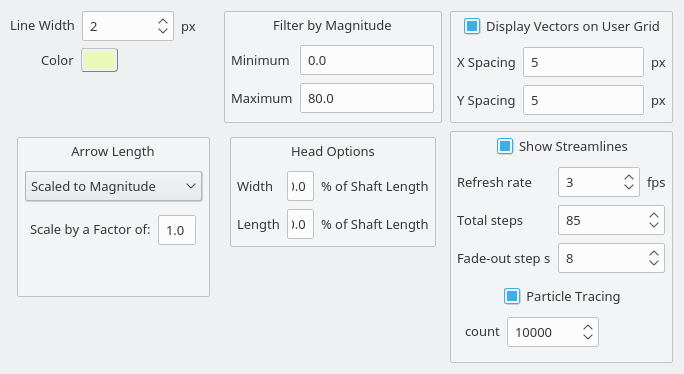
To view wind data as trace animation, move the slider time to 12.09.2017 07:00 (or 319:00:16.04 if your time is set to relative) and select Vector Options. Set the parameters according to the dialog window below:

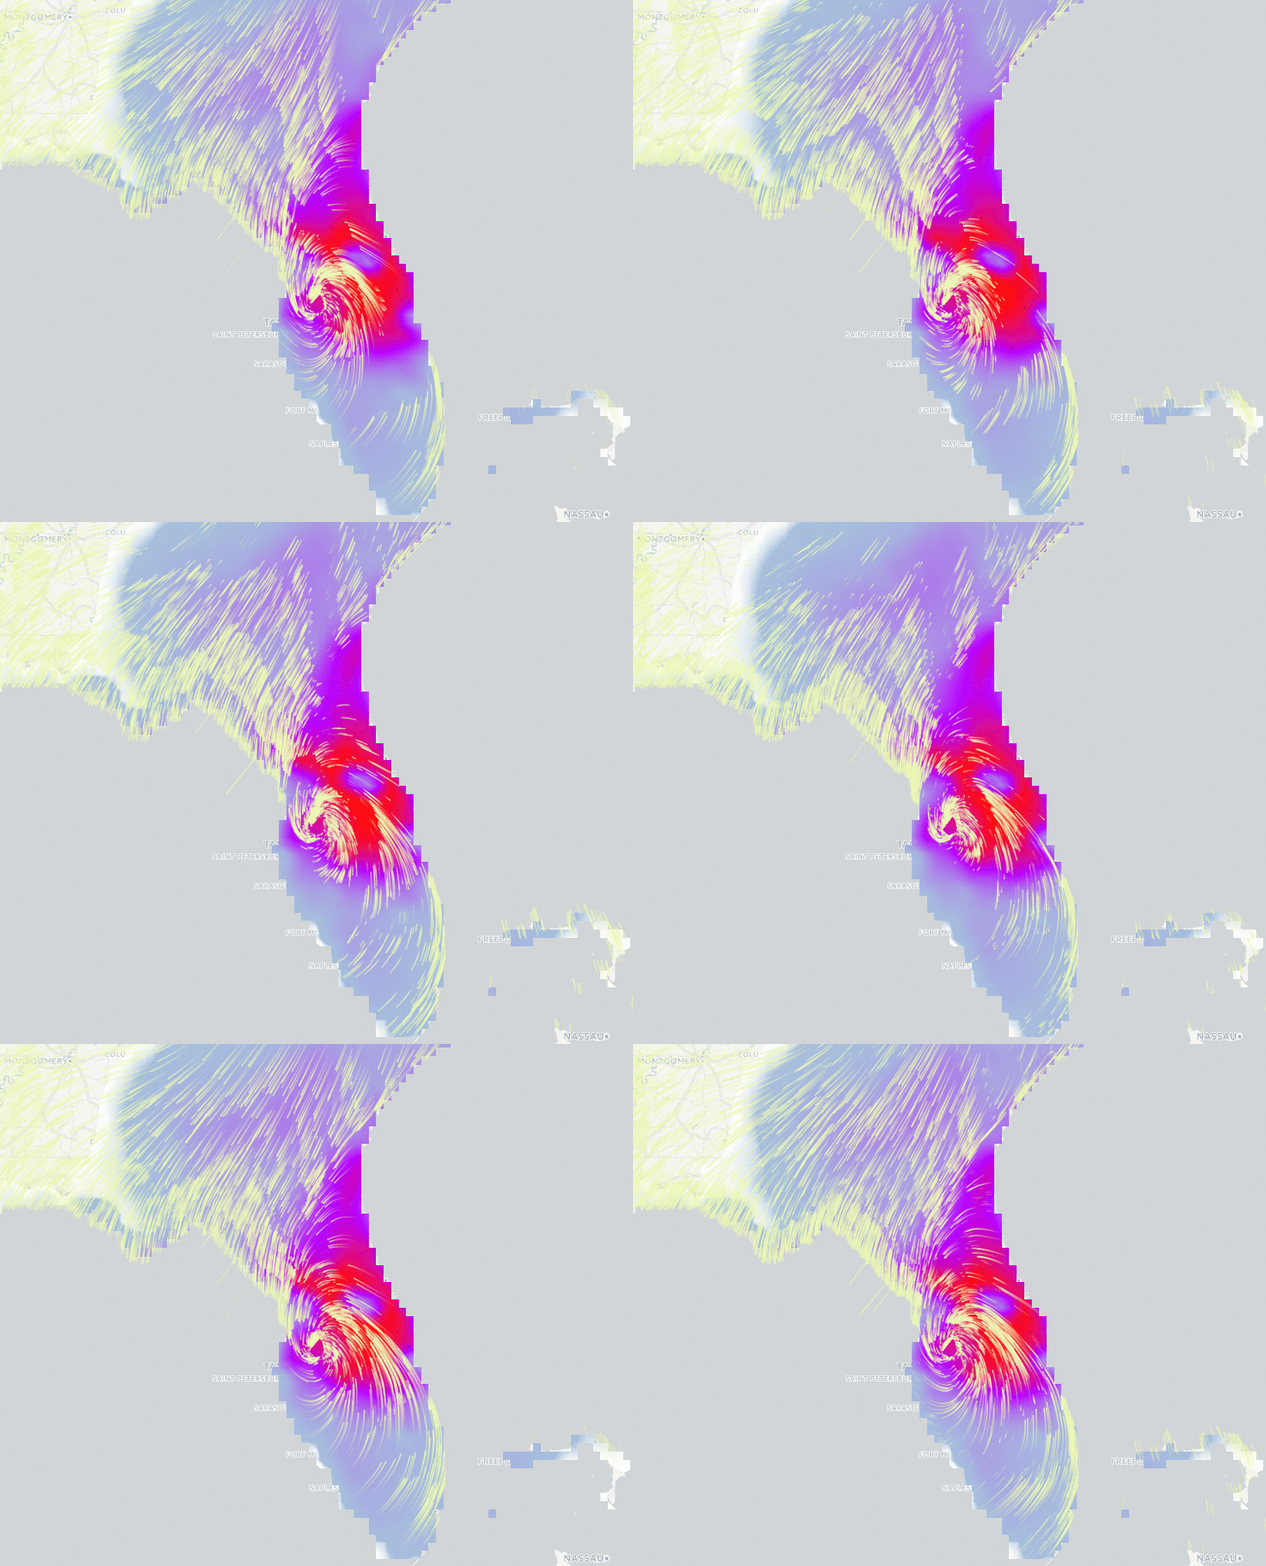
You should now be able to see live traces of the wind from your QGIS canvas:

You can plot the time series by clicking on the plot tool  from Crayfish panel:
To generate an animation of precipitation and wind, you need to first click on  from Crayfish panel and then enable wind vectors and precipitation grid. From Plugins > Crayfish > Export to animation you can generate animation of your time series.
Support funding Crayfish port to QGIS 3
If you are interested in using Crayfish in QGIS 3, help with this crowd-funding.
You may also like...
Mergin Maps, a field data collection app based on QGIS. Mergin Maps makes field work easy with its simple interface and cloud-based sync. Available on Android, iOS and Windows.

