Crowdfunding Status: Successful
UPDATE 19/02/2021
We have published the list of contributors in a blog post. Huge thanks to everyone who contributed or supported us last couple of months during the crowdfunding campaign and development.
Today also marks the official release of QGIS 3.18. We are hoping you will enjoy the new functionality just as we enjoyed building it for the amazing QGIS community!
UPDATE 29/09/2020
We have identified several extra goals we would like to achieve while working on the implementation of point clouds in QGIS. All of these are high priority pieces of infrastructure that would make working with point clouds better. We guarantee that any funds over the original requested amount will be used to work towards these goals. Please consider pledging towards the campaign to allow us to make the point clouds support in QGIS even smoother and easier to use:
- Refine 3D navigation for point clouds
possibly new navigation modes or shortcuts (also fixing issues with the current mode, like more flexible rotation center choice). - Expose point cloud metadata in layer properties
and ensure PDAL has the appropriate API available to retrieve all useful source Metadata. - Support for existing indexed point cloud format
useful especially for those already having point cloud data converted to a visualization friendly format (for example those using Entwine, Potree, 3D Tiles or I3S). - Improvements of the mechanism to load 3D data
to make data loading in 3D views faster and smarter. For example, sometimes QGIS loads data that were requested at some point, but they are not needed for the current view anymore.
UPDATE 21/09/2020:
Success! We have successfully reached our original goal of 49000 EUR. Thanks to the outpouring of support we've seen from the community, we've decided to extend the campaign with some very exciting stretch goals! We'll be announcing these soon, and they will build on the funded point cloud functionality with further improvements to QGIS 3D and the upcoming point cloud support.
Introduction
With the recent advancements in LiDAR survey technology and photogrammetry there has been a growing demand in capturing and storing point cloud data. Point cloud data are vector in nature, but are usually orders of magnitude larger than a standard vector layer. Typical vector datasets range from thousands to millions of features, while point clouds range from millions to billions or even trillions of points. Due to this sheer number of points a completely different approach to visualise, analyse and store point clouds is needed in a GIS platform.

In the open source GIS world, there are some fantastic tools to work with point clouds. PDAL (“Point Data Abstraction Library”) has become an important tool that supports multiple input data formats and also comes with plenty of algorithms for processing of point clouds. For visualisation on the web, the Potree JavaScript library has been the common choice. To visualise point clouds in a desktop application, users would typically open CloudCompare which comes with a variety of built-in tools.
Visualisation of point cloud data in open source desktop GIS applications is still missing. Integrated point cloud viewer in GIS would add a lot of value for users compared to a specialised and dedicated point cloud viewer:
- Point cloud data can be visualised, compared, and analysed alongside other types of spatial data (including vector, raster and mesh layers)
- Familiar user interface and workflows
- Integration with analytical tools to quickly create derived datasets
We have decided to bridge this missing gap and add point cloud support in QGIS, and are using this crowdfunding campaign to fund this work.
Within this project we will add point clouds as a new map layer type in QGIS. Users will be able load and visualise point cloud data in both 2D and 3D map canvases (similar to vectors and rasters), interact with the data (e.g. using the Identify Tool to get information about individual points), and style the data using different classification techniques. Behind the scenes there will be an integration with the PDAL (Point Data Abstraction Library) library and indexing of data for optimised visualisation. For more technical details about the project please see our QGIS Enhancement Proposal.
This is a joint crowdfunding campaign conducted by 3 highly respected, proven companies committed to open source GIS:
![]()
![]()

Together, we’ve put together a team of outstanding quality and complementary skills:
- Lutra Consulting (based in the UK) has been contributing to QGIS for more than ten years and are leading development of the 3D map view within QGIS
- North Road(based in Australia) are one of the leading forces in QGIS development, adding great amount of new features with a lot of focus on beautiful cartographical and analytical capabilities
- Hobu (based in the US) has been extremely active in the fundamental FOSS4G libraries including GDAL , PROJ and others. More importantly, Hobu has been leading the development of PDAL library for nearly 10 years.
Scope of the project
With this crowdfunding we will intend to introduce the initial infrastructure in QGIS to handle the following items:
Integration of PDAL
As previously mentioned, the PDAL library is a great piece of software for reading/writing and processing of point cloud data. With a similar philosophy to the highly respected GDAL library, it is a natural fit for QGIS which already uses GDAL (for raster and vector data) and MDAL (for mesh data). Thanks to PDAL library, we will get immediate access to a multitude of point cloud formats, including many common formats like LAS and LAZ files.
QGIS wouldn't be the highly respected, mature application it is today without support from the wider open-source geospatial community! Accordingly, in designing this project we've worked closely alongside the other existing open source tools and libraries for point cloud use. Part of the funding from this campaign will be used to directly improve the PDAL library itself, which has flow-on benefits to dozens of other open-source applications!Loading data
Users will be able to add point clouds to QGIS just like any other raster or vector format - by opening datasets in Data Sources Manager or by direct drag’n’drop from their file browser (or the integrated QGIS browser panel).
QGIS would read the dataset and create an internal index of the point cloud in order to allow fast data visualisation in 2D or 3D map views, without having to keep all the data in memory. This approach ensures that QGIS will be capable of working with extremely large point cloud datasets without running out of system memory.
Styling data
Just like their vector and raster counterparts, there will be different options to style point cloud layers based on their values:
- Coloring based on elevation (Z coordinates)
- Coloring based on classification of points (ground, vegetation, …)
- Coloring based on RGB values (for datasets with color information)
- Coloring based on other attributes (e.g. reflection intensity, return number)
- Configurable size of points
It will be also possible to apply filtering of point cloud data to view only a subset of data, for example:
- Filter by elevation - only show a specific range of Z coordinates
- Filter by classification - only display points classified as buildings
- Filter by return number - only display the last return of each LiDAR pulse
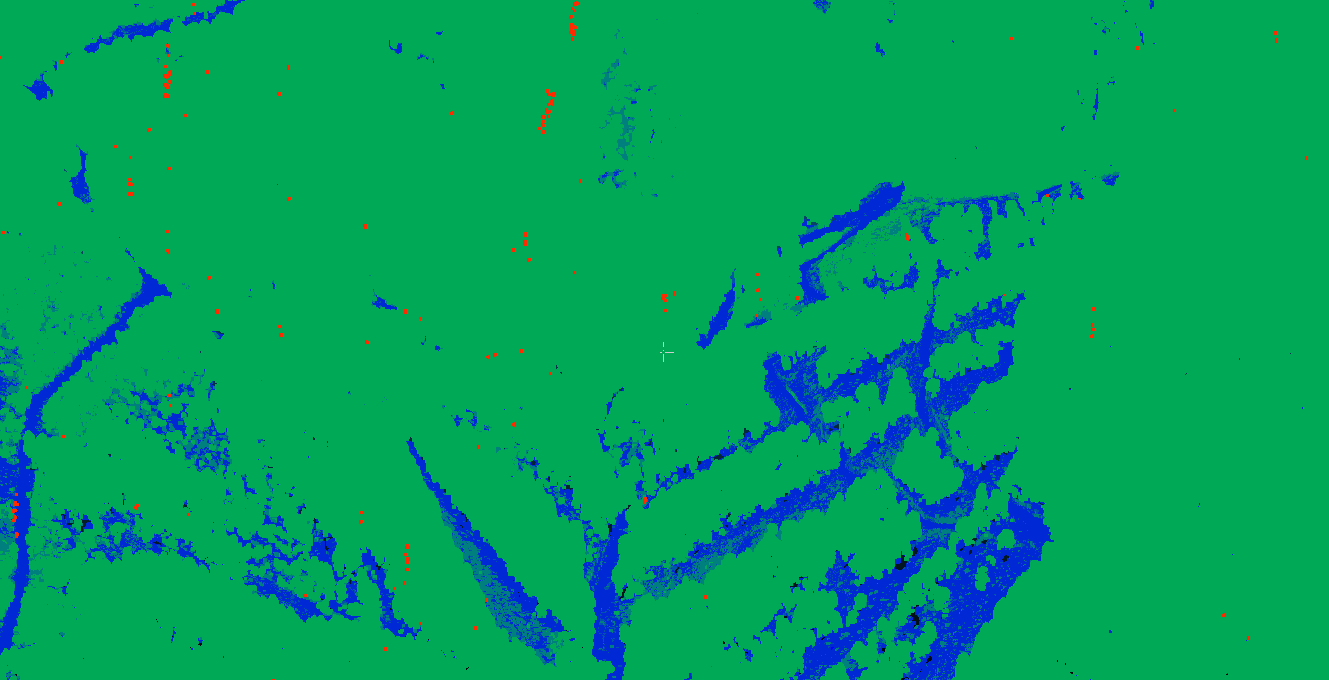
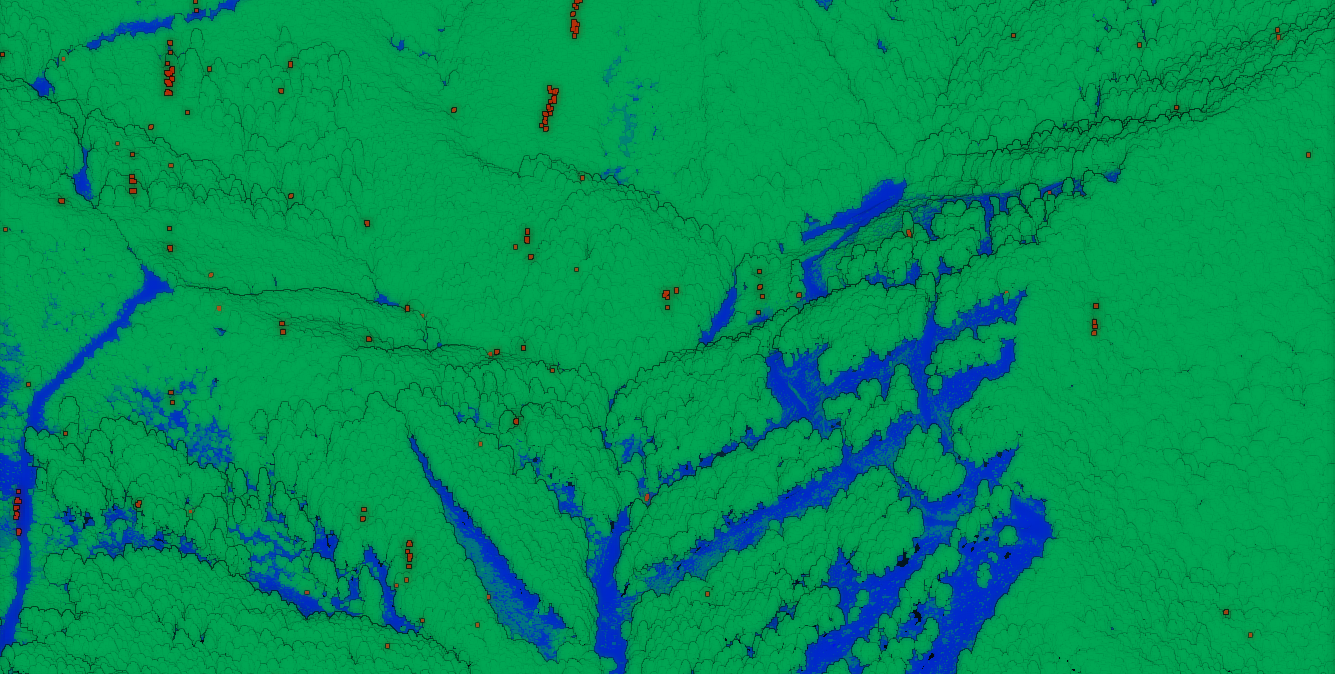
We also plan to add the eye-dome lighting effect which greatly improves the depth perception of point cloud data. It adds shading and silhouettes based on the depth of neighboring points, improving the final rendering quality. For comparison - the same point cloud (colors according to classification), the top image without eye-dome lighting, the bottom image with eye-dome lighting:
2D/3D map view
Most importantly, users can view the point cloud data in 2D or 3D map canvas. The added benefit of having full integration with QGIS will be that other data (vector/raster) can be overlaid together with the point cloud data.
To allow fast 2D and 3D rendering even in case of large datasets, QGIS will be able to render subsets of data thanks to the hierarchical index (generated when data is first loaded in QGIS). When the user zooms out, QGIS would only draw a small amount of points, and as soon as the user zooms in, QGIS would draw increasingly higher amounts of points (yet in a smaller map extent).
Identification of points
The Identify map tool in both 2D and 3D map canvases will be updated to also return full information about identified point(s). Alongside their XYZ coordinates it will also return the value of other attributes of each point (such as classification and other attributes).
Timeline
We plan to commence the work once the target for our crowdfunding campaign has been reached. We aim to have the native support for point cloud data ready in QGIS 3.18, due to be released in February 2021.
Crowdfunding
By supporting this project, you will help integration of PDAL to QGIS and also visualisation and styling of point cloud data in QGIS.
This project cannot go ahead without your support! We use crowdfunding to raise funds for projects like this one which benefit a wide community of users. The project will only go ahead if sufficient funding can be raised before the project crowdfunding deadline. Please see our main crowdfunding page for more information about our crowdfunding initiative and how it works.
Pledging funds is safe and easy. Simply fill in the pledge form to state how much you want to pledge - pledges only become binding if the funding target is reached before the deadline.
If you are based in the US or Australia and have difficulty pledging funds to companies outside your country, please contact Hobu or North Road to facilitate your contribution.
VAT and your pledge
Because there's a specific goal to this crowdfunding exercise, pledges may be subject to VAT (value-added tax). Please read this section to understand how your pledge will be treated for VAT purposes.
If you are based outside the EU (european union) then VAT is not applicable to your pledge and the full pledge will be allocated to the campaign.
If you are based in the EU (but not in the UK) and have registered as an individual (you are not VAT registered) then your pledge will be considered inclusive of VAT at 20% meaning about 83% of your pledge will be allocated to the campaign.
If you are based in the EU (but not in the UK) and have registered as an organisation (and you have provided a valid VAT registration number) then your pledge will be considered exclusive of VAT at 0%. We will provide a reverse charge VAT invoice and your full pledge will be allocated to the campaign.
Similarly, if you are based in the UK, your pledge is considered inclusive of VAT at 20% if you registered as an individual and exclusive of VAT at 20% if you registered as an organisation.
About us
This effort has been organised and led by Lutra Consulting in collaboration with North Road and Hobu. All companies have a history of running successful campaigns to enhance Open Source GIS applications. For some of our past works see:
Future work
We have many more ideas how to further enhance point cloud data support in QGIS! Some of the things we would like to look at after the initial work is done:
- Integration of algorithms from PDAL to QGIS Processing toolbox
- Profiles of point cloud data (based on a polyline)
- Support of online datasets (Potree format, Entwine EPT, 3D Tiles and others)
In case the crowdfunding campaign would exceed the target amount, we will be happy to work on some of these topics as well.