Somewhere on a shared drive there is a DWG of a water network. It has four hundred layers, a naming convention that only a few people understand, and every valve marked with a block and a text label sitting next to it. It is a good drawing. It was surveyed properly, drafted properly, and it prints beautifully at A1.
Then someone asks how many valves sit inside pressure zone 4, and how many of those were installed before 2005. The drawing cannot answer that. Not because the information is missing, but because it is stored as marks on a sheet rather than as data. Somebody opens the file, zooms to the zone boundary, and starts counting by eye. Two days later there is a number that nobody can reproduce.
This is not a case of the wrong tool being used badly. CAD is doing exactly what it was designed to do. The problem is that it was asked a question it was never built to answer.
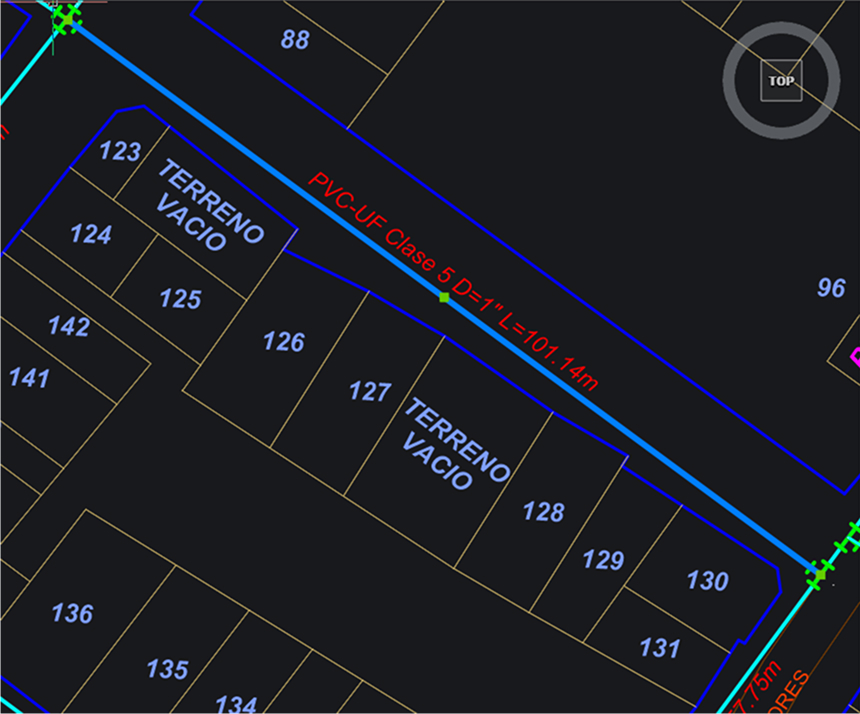
This reputation has understandably followed CAD for decades. CAD software is designed for drawing with precision. The command line, the constraint system, the drawing tools, all of it is built so that you can confidently draw a line that is exactly 3.25 metres long and exactly perpendicular to its neighbour. GIS is not inherently designed for that kind of engineering work, but it does possess the tools to draw with equal level of precision, and we’ll get to that later.
On top of that, precision and accuracy are not the same claim. CAD precision is relative: everything is exact with respect to an origin that often sits somewhere arbitrary, on a plane that is assumed to be flat. A building is a building, it doesn’t matter where it is located to draw it. But the assumption stops holding accurately across a site, and it fails across a region. That’s where coordinate reference systems (CRS) come in, to ensure that a pair of coordinates corresponds accurately to the same place on the Earth's surface. Most CAD software include CRS functionality, but it’s just that: functionality, an option. For GIS it’s not an option; the software is largely built around CRS.
For a GIS layer, the CRS is one of its properties, it is identified by an EPSG code that means the same thing in every piece of the software that reads the file. Behind that sits a transformation engine, PROJ in the case of QGIS, which tracks the EPSG registry as it changes and chooses an appropriate transformation path. Autodesk products run on a different engine, CS-Map, and with a different logic, as the CRS is assigned to the drawing only. Both are open libraries, and neither is doing anything exotic with projection maths. The difference is upkeep and bookkeeping. PROJ ships releases on a regular cadence and tracks the EPSG registry as it changes, while CS-Map's distribution still carries project files for Visual Studio 2008 through 2012. Autodesk's own guidance warns that data saved from such a drawing back into ArcGIS software can pick up a small positional offset. Nothing errors. The geometry just lands slightly off where it belongs.
So is CAD really more accurate than GIS? While CAD is by design built around precision engineering work, GIS doesn’t really lack such capabilities. But most importantly, if your work is truly tied to the Earth’s surface, then the way GIS incorporates and handles spatial reference makes it the most reliable option.
A point in a CAD drawing is a coordinate pair. If it carries information, that information lives beside it: a block attribute, a text entity, a linked table in another file, meant to be read by a person, not software. A point in a GIS layer is a coordinate pair with a table attached to it, and the table is part of the layer rather than a companion to it. Each valve carries its diameter, its material, its install date, its last inspection. You can sort it, filter it, join it to a maintenance spreadsheet, drive the symbology from it, and label from an expression instead of placing text by hand.
The second part of this picture is where the data lives. A DWG is a document. It holds geometry, styling, sheet setup and the drafter's intent in one container, and pulling the data out means pulling it away from all of that. On the other hand, a GeoPackage, a very popular option for storing spatial data, is a database. One file, many layers and tables, open format, readable by anything. The data is the deliverable, and the map is one of several things you make from it.
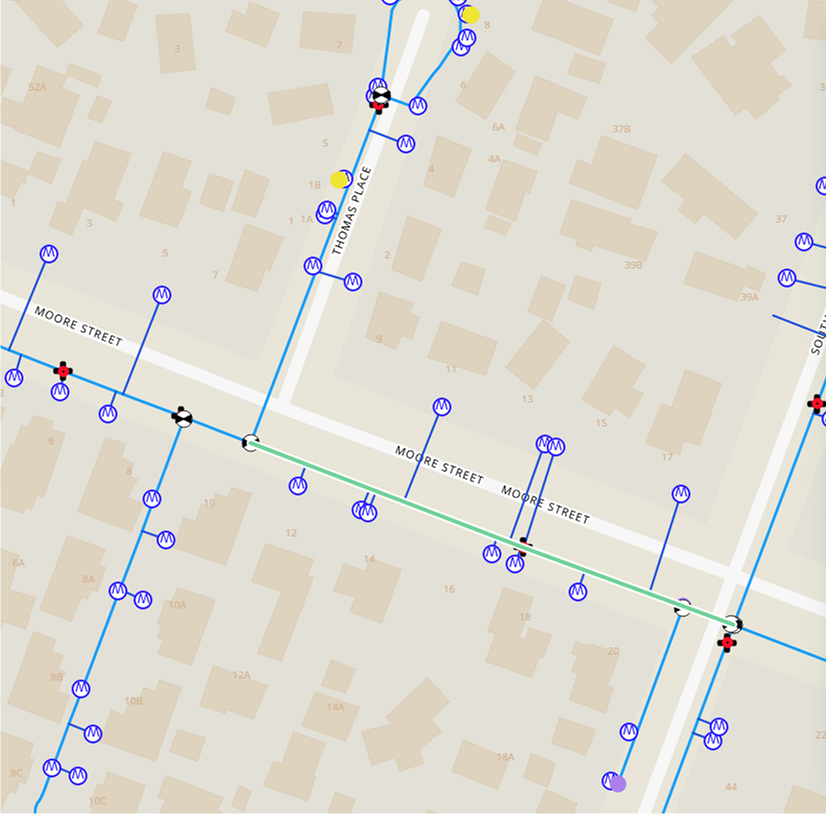
Once your drawing has become a spatial dataset, there is virtually no spatial question for which you can’t get answers out of that dataset.
1. How many valves sit in zone 3, installed before 2005? A spatial join between the valve layer and the zone polygons, then a filter on the date field. The answer arrives as a table, and it recalculates when someone adds a valve.
2. Which parcels does the proposed route cross, and by how much? An intersection between the route and the cadastral layer, with length calculated per parcel. That is your notification list and your easement schedule, generated rather than transcribed.
3. Which service connections fall inside the 100-year flood extent? Select by location, export the result, and hand it to the risk team.
None of this is exotic. It is buffer, clip, intersect, join, and select by location, the five operations that carry most GIS work. What matters is that each one is repeatable, auditable, and survives the person who ran it. Nobody counts symbols by eye again.
Start with the coordinate reference system, before importing anything. Find out what the drawing is actually in, and be skeptical of the answer. DWG and DXF carry coordinates, not a declared CRS, and where a coordinate system has been assigned it tends to live in a drawing setting rather than travel with the geometry. If the file is in a real projected system, you define that in QGIS. If it is in an arbitrary site grid, or it is a scanned plan, you georeference it against known control. Defining and georeferencing are different operations and confusing them is the most common way a migration goes wrong on day one.
Then import. QGIS reads DXF and DWG directly, and the DXF import tool will split entities into separate layers by geometry type. As another option, the AnotherDXFImporter plugin handles the DXF imports beautifully, splitting the layers into tables in a Geopackage and styling them exactly as they were in the drawing.
Some cleanup is expected. Arcs and circles arrive segmented. Blocks come across as insertion points rather than as the symbol you drew. Hatches, text entities and line styles may or may not survive in a useful form. Layer name is often the only attribute you get, which means your first real task is turning drafting structure into a proper attribute schema.
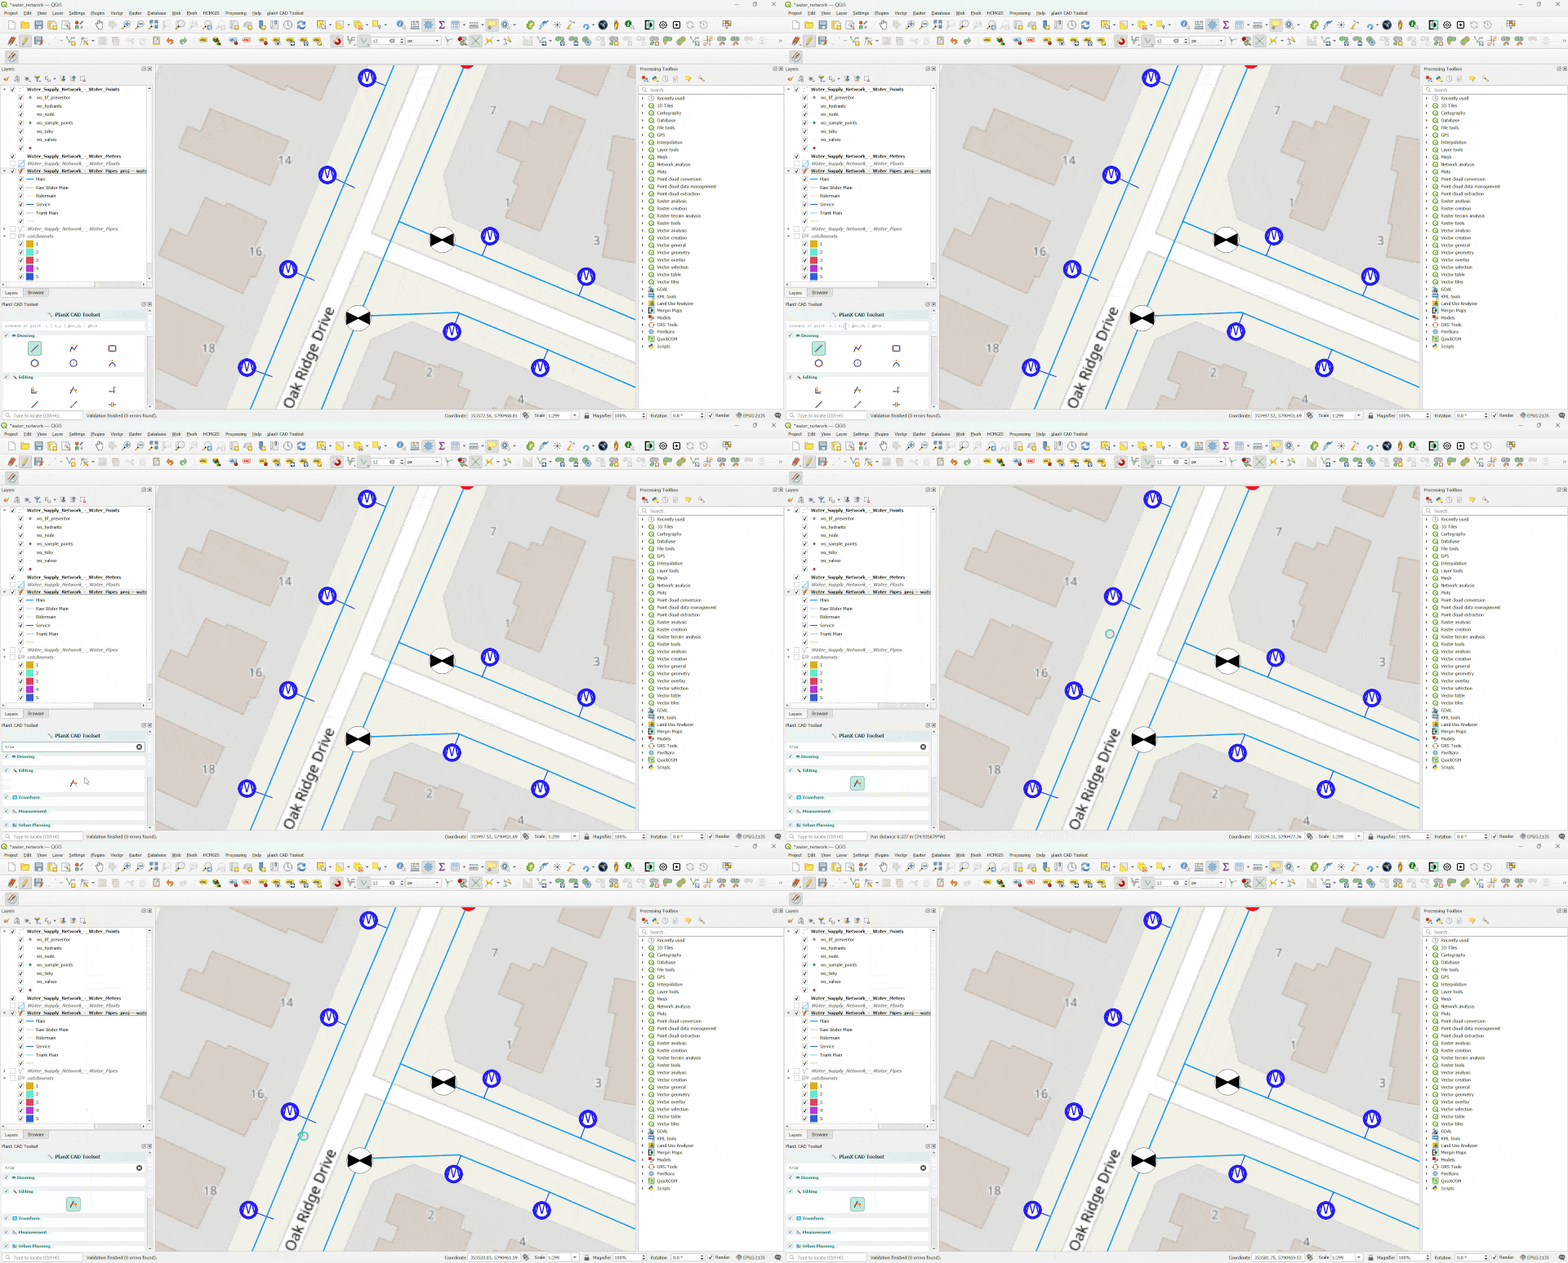
QGIS is not a blank canvas where you push vertices around with a mouse. The Advanced Digitizing Panel is the closest thing to a CAD command line. You can lock an angle to exactly 90 degrees, type an exact distance, constrain X or Y, and draw parallel or perpendicular to an existing segment. Coordinates and distances are typed, not dragged.
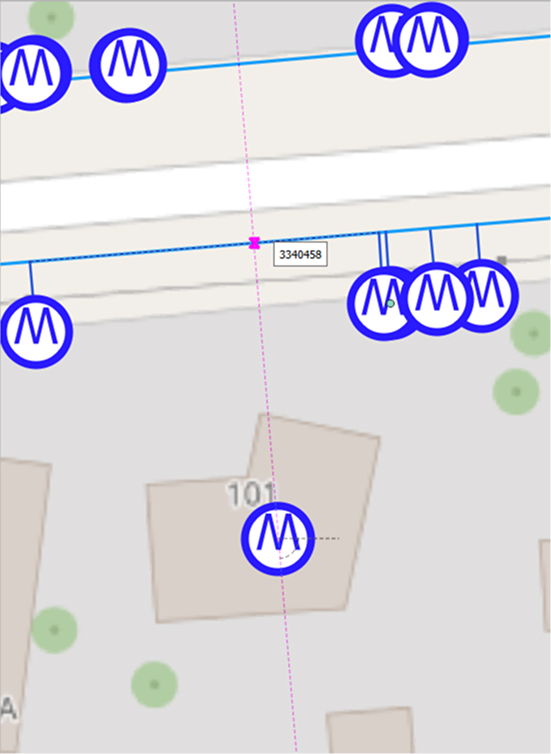
The snapping toolbar handles the rest: snap to vertex, segment, intersection or middle, with tolerances you set per layer. Topological editing means a shared boundary stays shared when you move it, and tracing lets you follow an existing feature's edge rather than redrawing it.
Plugins close most of the remaining gap. DigitizingTools adds splitting, reshaping and multipart handling. QAD and CADDigitize recreate familiar commands such as trim, extend, fillet and offset inside the QGIS interface. For measurement, expression-based labels can print a line's real-world length automatically, and dimensioning plugins draw CAD-style dimension lines in a layout.
Nothing above is an argument for deleting AutoCAD. Detail design belongs in CAD. Anything dimensioned for fabrication or construction belongs in CAD. Sheet sets, title blocks, drawing standards, the whole apparatus of a signed and issued deliverable belongs in CAD, and trying to reproduce it in a GIS layout is a fight you will lose slowly. If you are working at millimetre tolerance on a single structure, the flat plane assumption is correct and the extra machinery of a coordinate reference system buys you nothing.
The useful question is not which tool is better. It is which tool owns which stage. CAD owns design and the issued drawing. GIS owns the asset once it exists in the world, where it needs a real position, an attribute record, a history, and a relationship to everything around it.
These are not sealed systems. DXF moves in both directions, and a sensible workflow exports the designed geometry into GIS once it is built, and pulls current asset data back into CAD when the next scheme starts.
The reason this transition is worth the effort is not that QGIS can imitate a drafting package. It is that once your network exists as data with a declared coordinate system and a real attribute table, it stops being a file and starts being something the whole organisation can work against.
That includes the field. A crew standing over a valve can see the same layer the office sees, confirm the position against GPS, correct the diameter that was wrong on the drawing, attach a photo, and have it land back in the database before they reach the van. This is what Mergin Maps is built for, and it only becomes possible after the step described here. You cannot take a DWG to site and edit it meaningfully. You can take a GeoPackage.
So the migration is not really from one piece of software to another. It is from drawings that describe your network to data that answers questions about it.
Let's make the QGIS work for you
Lutra Consulting is a QGIS-focused expert provider of geospatial software development, consulting, training, and support services.