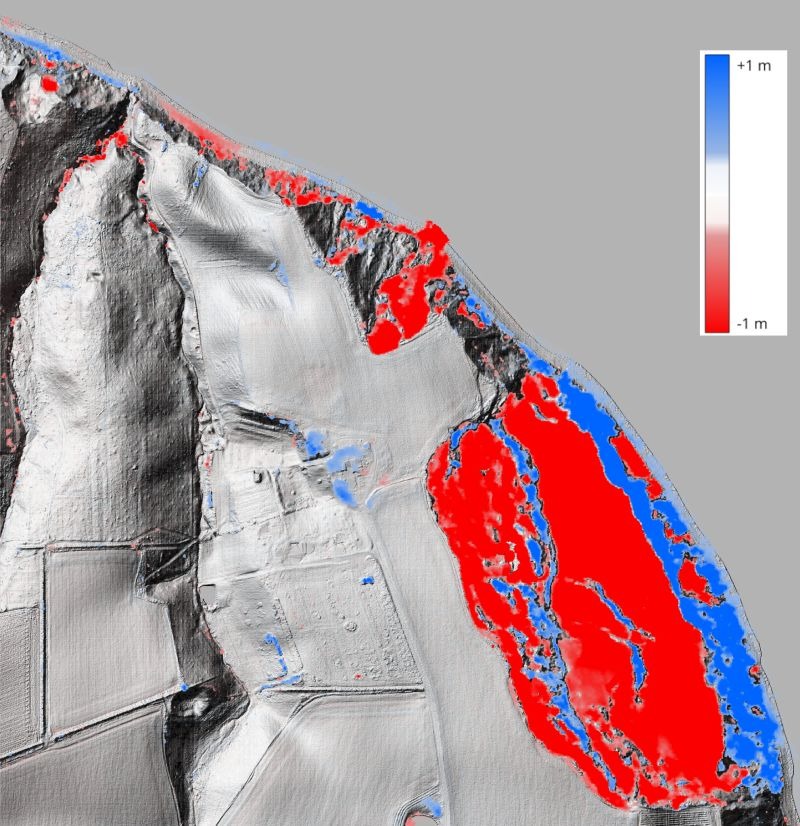
QGIS 4.0 includes a new processing algorithm for comparing two point clouds directly: M3C2 (Multiscale Model-to-Model Cloud Comparison). This work was funded by Danish Climate Data (Klimadatastyrelsen), Geological Survey of Denmark and Greenland (GEUS), and Septima, who needed a reliable way to detect erosion and landslide activity from repeat LiDAR surveys. Development was carried out by Lutra Consulting in collaboration with Hobu.
The standard approach to change detection from two point clouds is to rasterize both into DEMs, subtract one from the other, and read off the vertical differences. It works, but it has a few real limitations.
Gridding loses information. Converting a point cloud to a raster means interpolating between measurements. On rough or complex surfaces that smoothing can obscure genuine features or introduce artefacts. The original survey precision gets diluted the moment you commit it to a pixel grid.
It only measures vertical change. DEM subtraction gives you a Z difference. That is fine for flat terrain, but a cliff face retreating horizontally, a riverbank slumping diagonally, or a dune migrating laterally; none of these are captured accurately by a vertical-only measurement.
There is no statistical confidence. A raw DEM difference gives you a number but not a verdict. Without a principled uncertainty estimate, you are left applying an arbitrary threshold and hoping it separates real change from noise.
M3C2 was published by Lague, Brodu, and Leroux (2013) and has been the standard in geoscience change detection for over a decade. Until now, running it required tools. In QGIS 4.0 it is a standard processing algorithm, no intermediate conversion, no external tools.
The algorithm works directly on the raw point clouds. Rather than measuring vertical change, it measures displacement along the local surface normal; the direction the surface is actually facing at each point. This makes it accurate for vertical surfaces, slopes, and any geometry where change is not happening straight up and down.
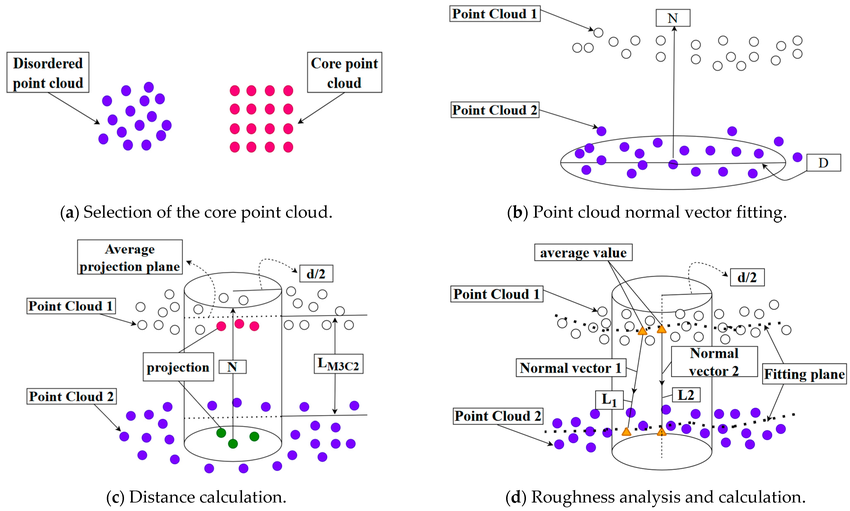
Two parameters control the spatial scales:
The key output alongside the change value is the Level of Detection (LOD), a 95% confidence interval that accounts for surface roughness, local point density in each cloud, and registration error between the two surveys. Any measured change smaller than its LOD is flagged as statistically insignificant. The result is not just a number but a defensible conclusion about whether change actually occurred.
The algorithm is available in the Processing Toolbox under Point Cloud Data Management → Compare Point Clouds. It takes two point cloud layers and the D and d parameters, and outputs a point cloud with the change magnitude and LOD per point, ready to style and analyse like any other layer.
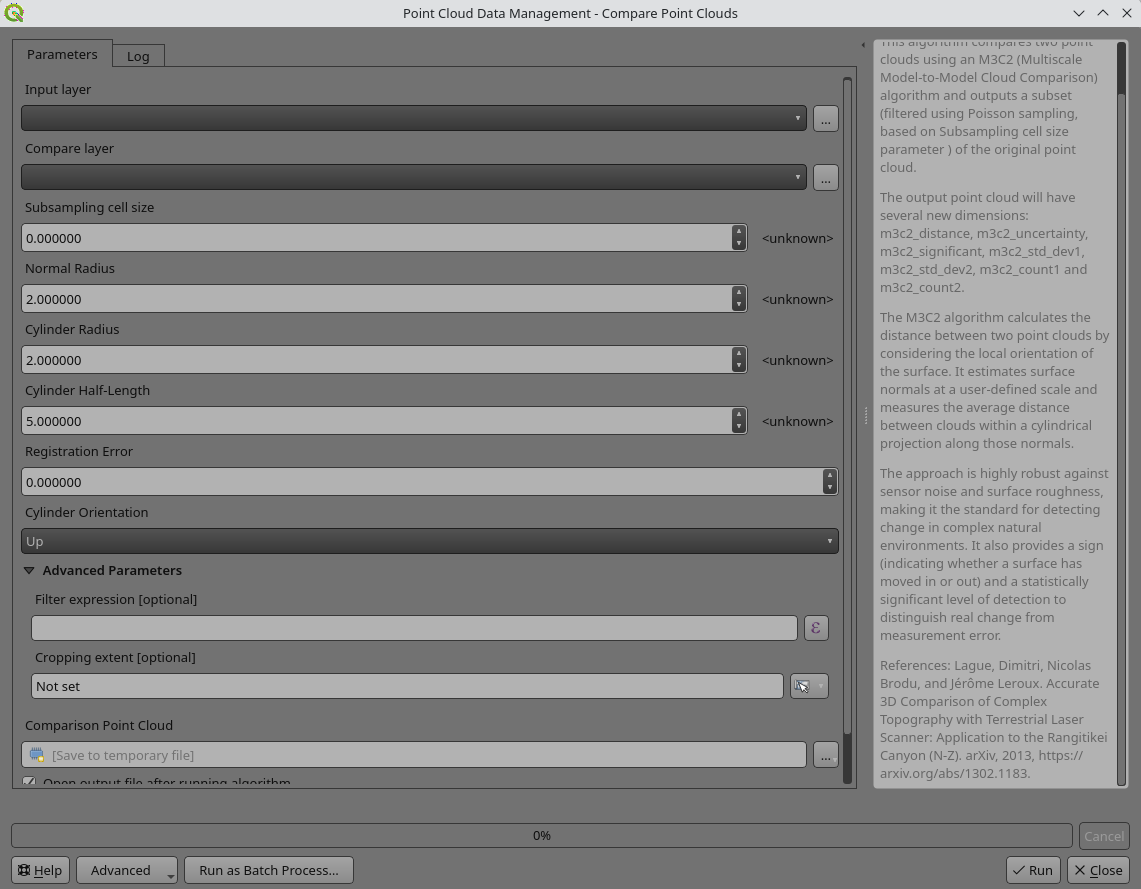
To better understand the algorithm, here are the input, output and parameters:
These are the settings the user must define before running the algorithm:
The result is a filtered subset of the original point cloud (reduced via Poisson sampling) featuring seven new metadata attributes calculated for every point:
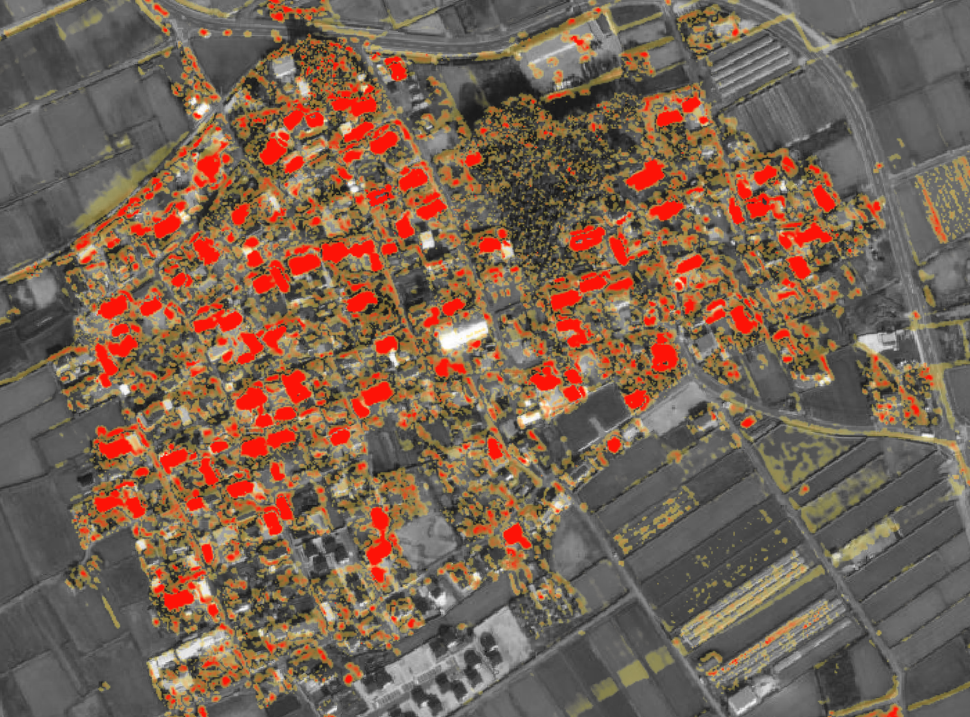
You can test this tool, you can use OpenTopography data from pre and post April 2016 earthquake scans in Kumamoto, Japan: https://portal.opentopography.org/dataSearch?search=Kumamoto.
The data were collected shortly before and after the earthquake and by comparing the point clouds, you can see the extent of the damage to the properties and surface deformation:
Read more about our point cloud abilities here.
Let's make the QGIS work for you
Lutra Consulting is a QGIS-focused expert provider of geospatial software development, consulting, training, and support services.